Quickstart: First Database in 5 Minutes
Sign up, connect your PostgreSQL via the hosted collector, and see your first metrics in under 5 minutes.
Five minutes is realistic if your database is reachable from the public internet and you have admin credentials at hand. In practice the slow part isn't the wizard. It's finding which Parameter Group your RDS instance uses, or remembering which Azure subscription owns the Service Principal you'll need for log access later. Pin those down first.
Prerequisites
- A PostgreSQL user that can run
CREATE ROLEandCREATE EXTENSION pg_stat_statements. On managed PG this is the master user you set when you created the instance —postgreson RDS, the "server admin" on Azure Flex,postgreson Cloud SQL. - The database reachable over the public internet, or the willingness to run our agent inside your network.
- Five minutes of focused time, plus a couple of minutes to find your Parameter Group / subscription / cluster identifiers.
We use the admin password once to provision a read-only role and then forget it. There's no place we store it. (Yes, really. The wrap key is in Azure Key Vault and the bootstrap path doesn't write the admin password anywhere.)
If your database is not on the public internet
If your DB lives behind a strict firewall and you don't want to open ingress to 20.107.185.112/29, the hosted flow won't work for you. Skip ahead to the agent setup page. The agent runs inside your network and pushes metrics to us over HTTPS; credentials never leave.
Provisioning the monitor role
- Go to app.monpg.app and click Sign Up.
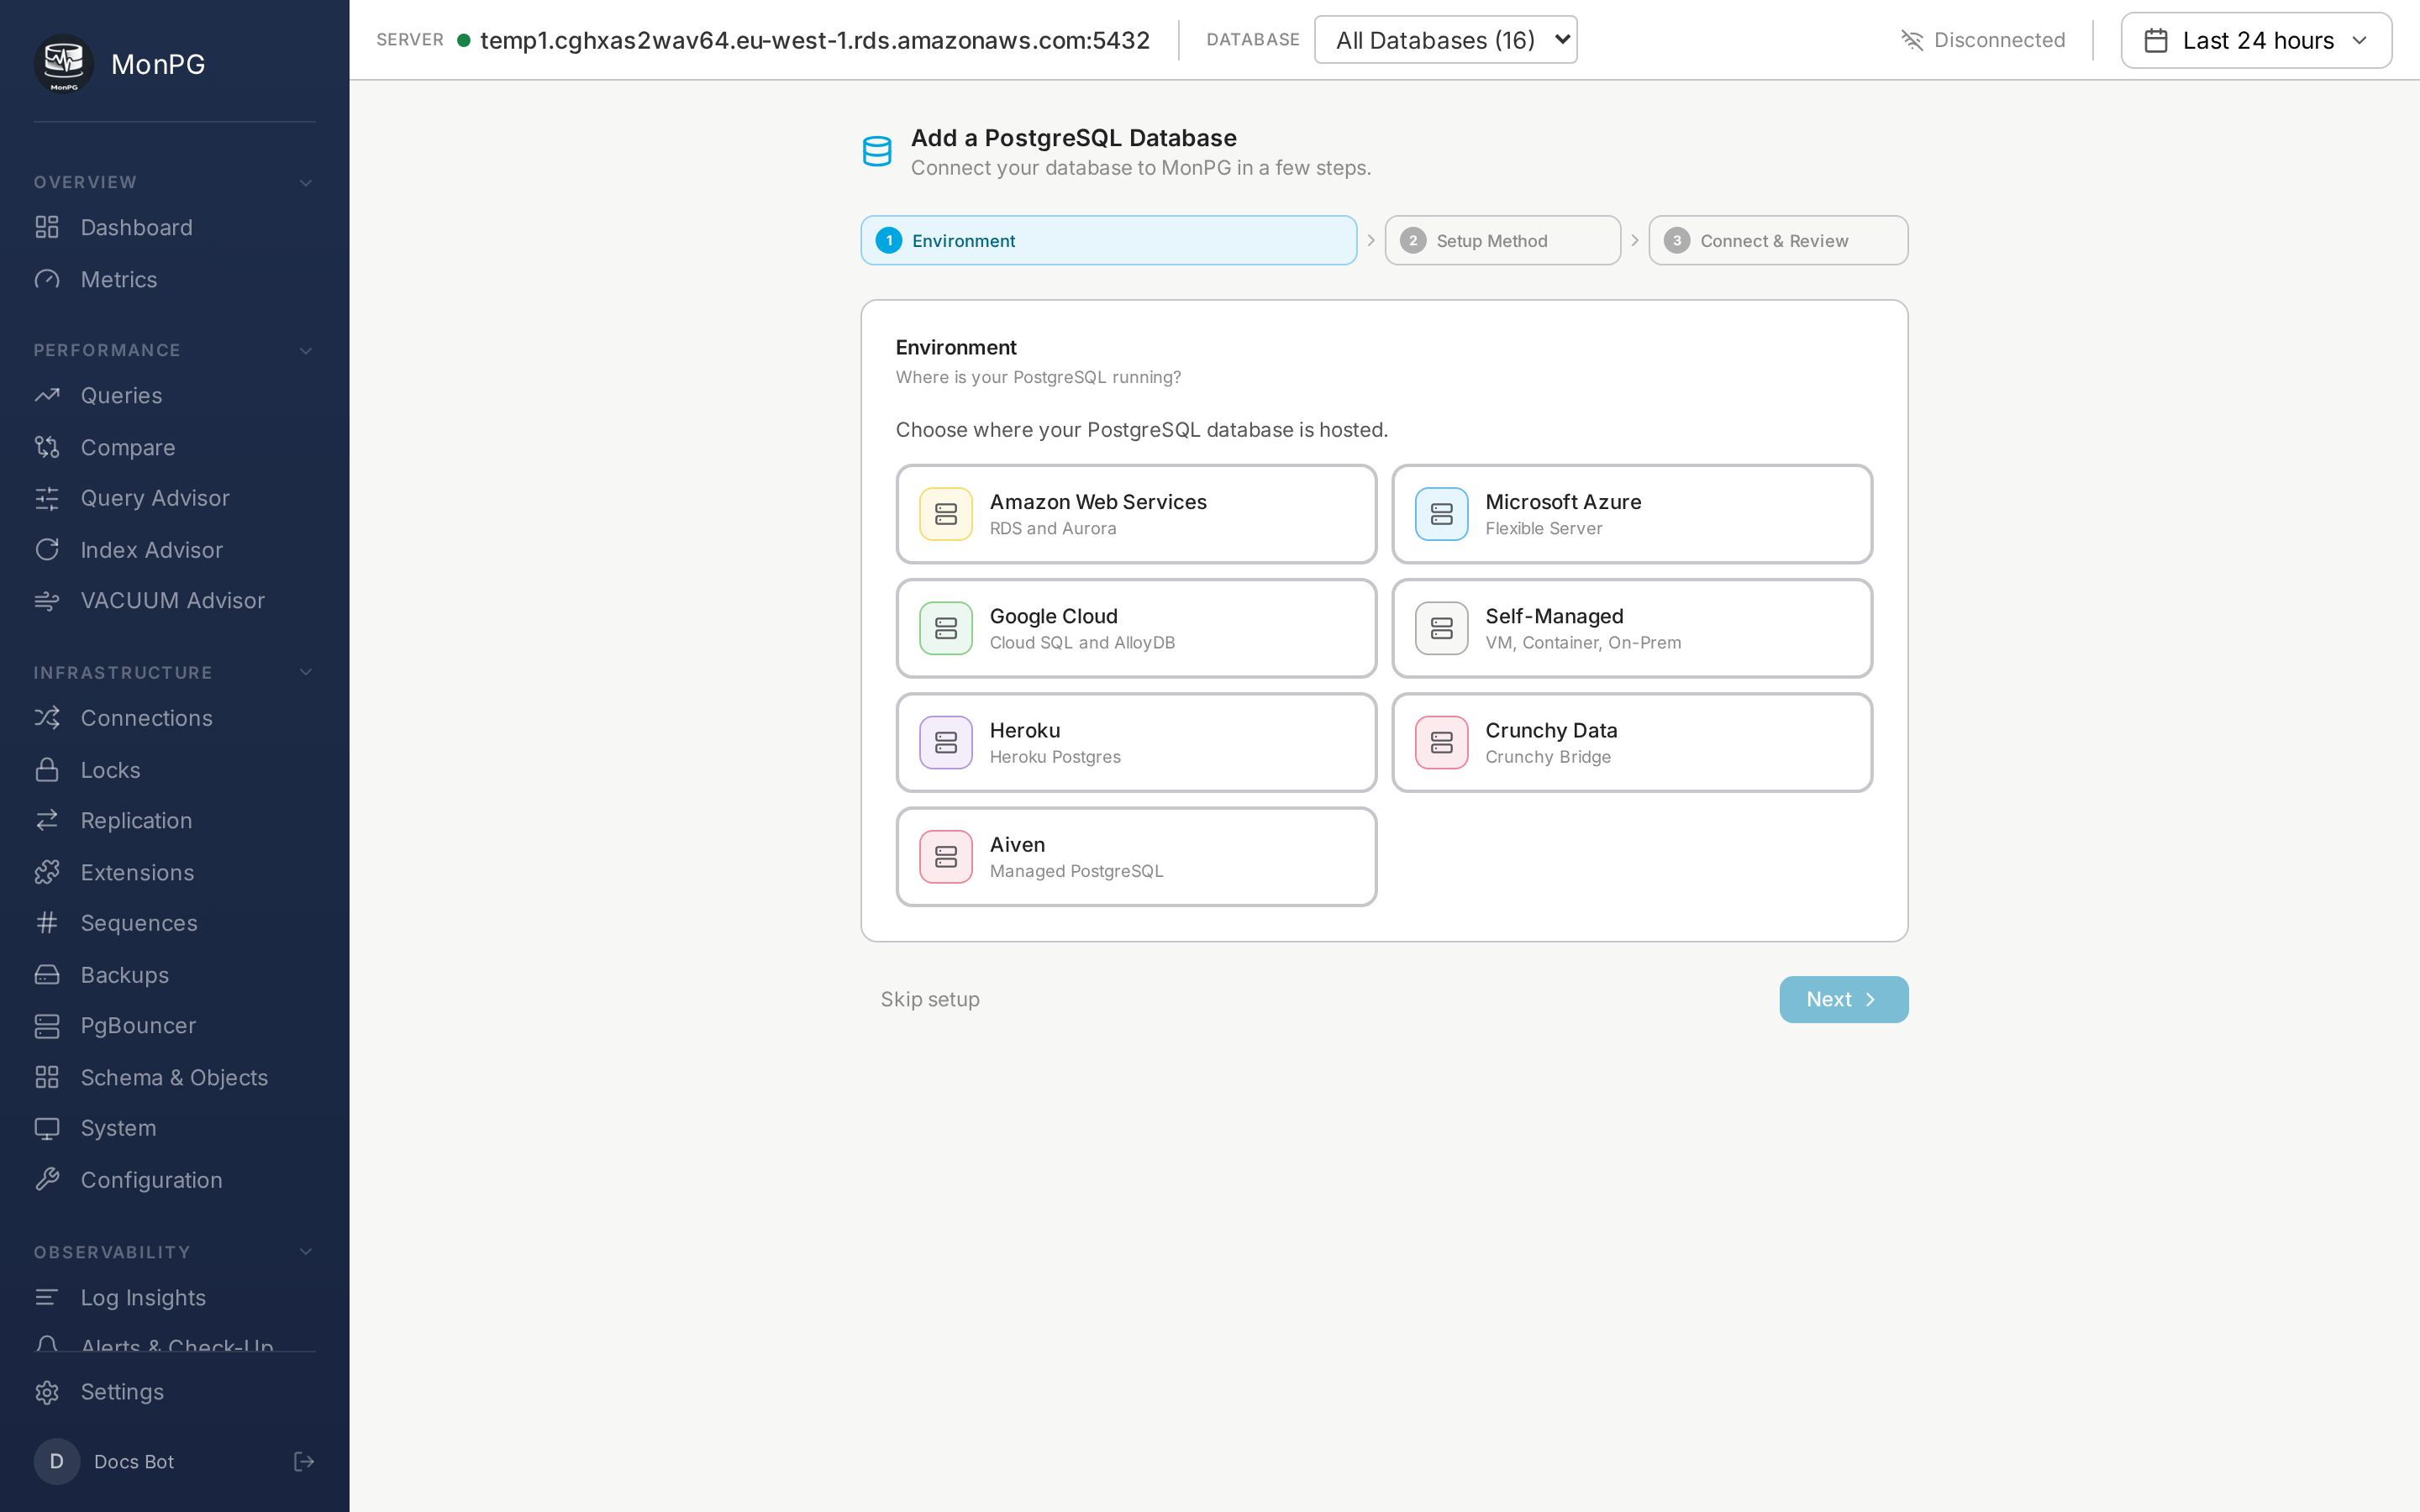
- On the Setup screen, pick your provider. The flow that comes next adapts to what you picked but the shape is the same.
- Enter the host plus admin password.
- Click Test connection. We probe the cluster — provider detection, extension inventory, current GUC values, discovered databases, whether
pg_stat_statementsis actually preloaded. - Review the consent surface. This screen tells you exactly what we'll do, what we won't (no GUC changes, no SPL changes, no restart), and the rollback script if you change your mind in two weeks. Read it before clicking Provision. We've put effort into making it specific rather than generic.
- Click Provision monitor role.
What happens after Provision
You're redirected to the dashboard. The first metric snapshot lands within about thirty seconds. The Queries page populates within a minute. Some pages stay blank longer because they need real data to work against:
- Query Advisor — needs slow queries to capture.
- Index Advisor — needs queries that would benefit from indexes.
- VACUUM Advisor — needs
pgstattuplefor accurate bloat.
The first hour walkthrough covers exactly what to expect.
If something looks wrong
If a widget is blank or you see "Disconnected" in the header after a few minutes, the cause is almost always a missing security group rule. Jump to troubleshooting.