Queries — Find What's Slow or Eating I/O
The Queries page is how you find performance outliers. Columns explained + filtering tips.
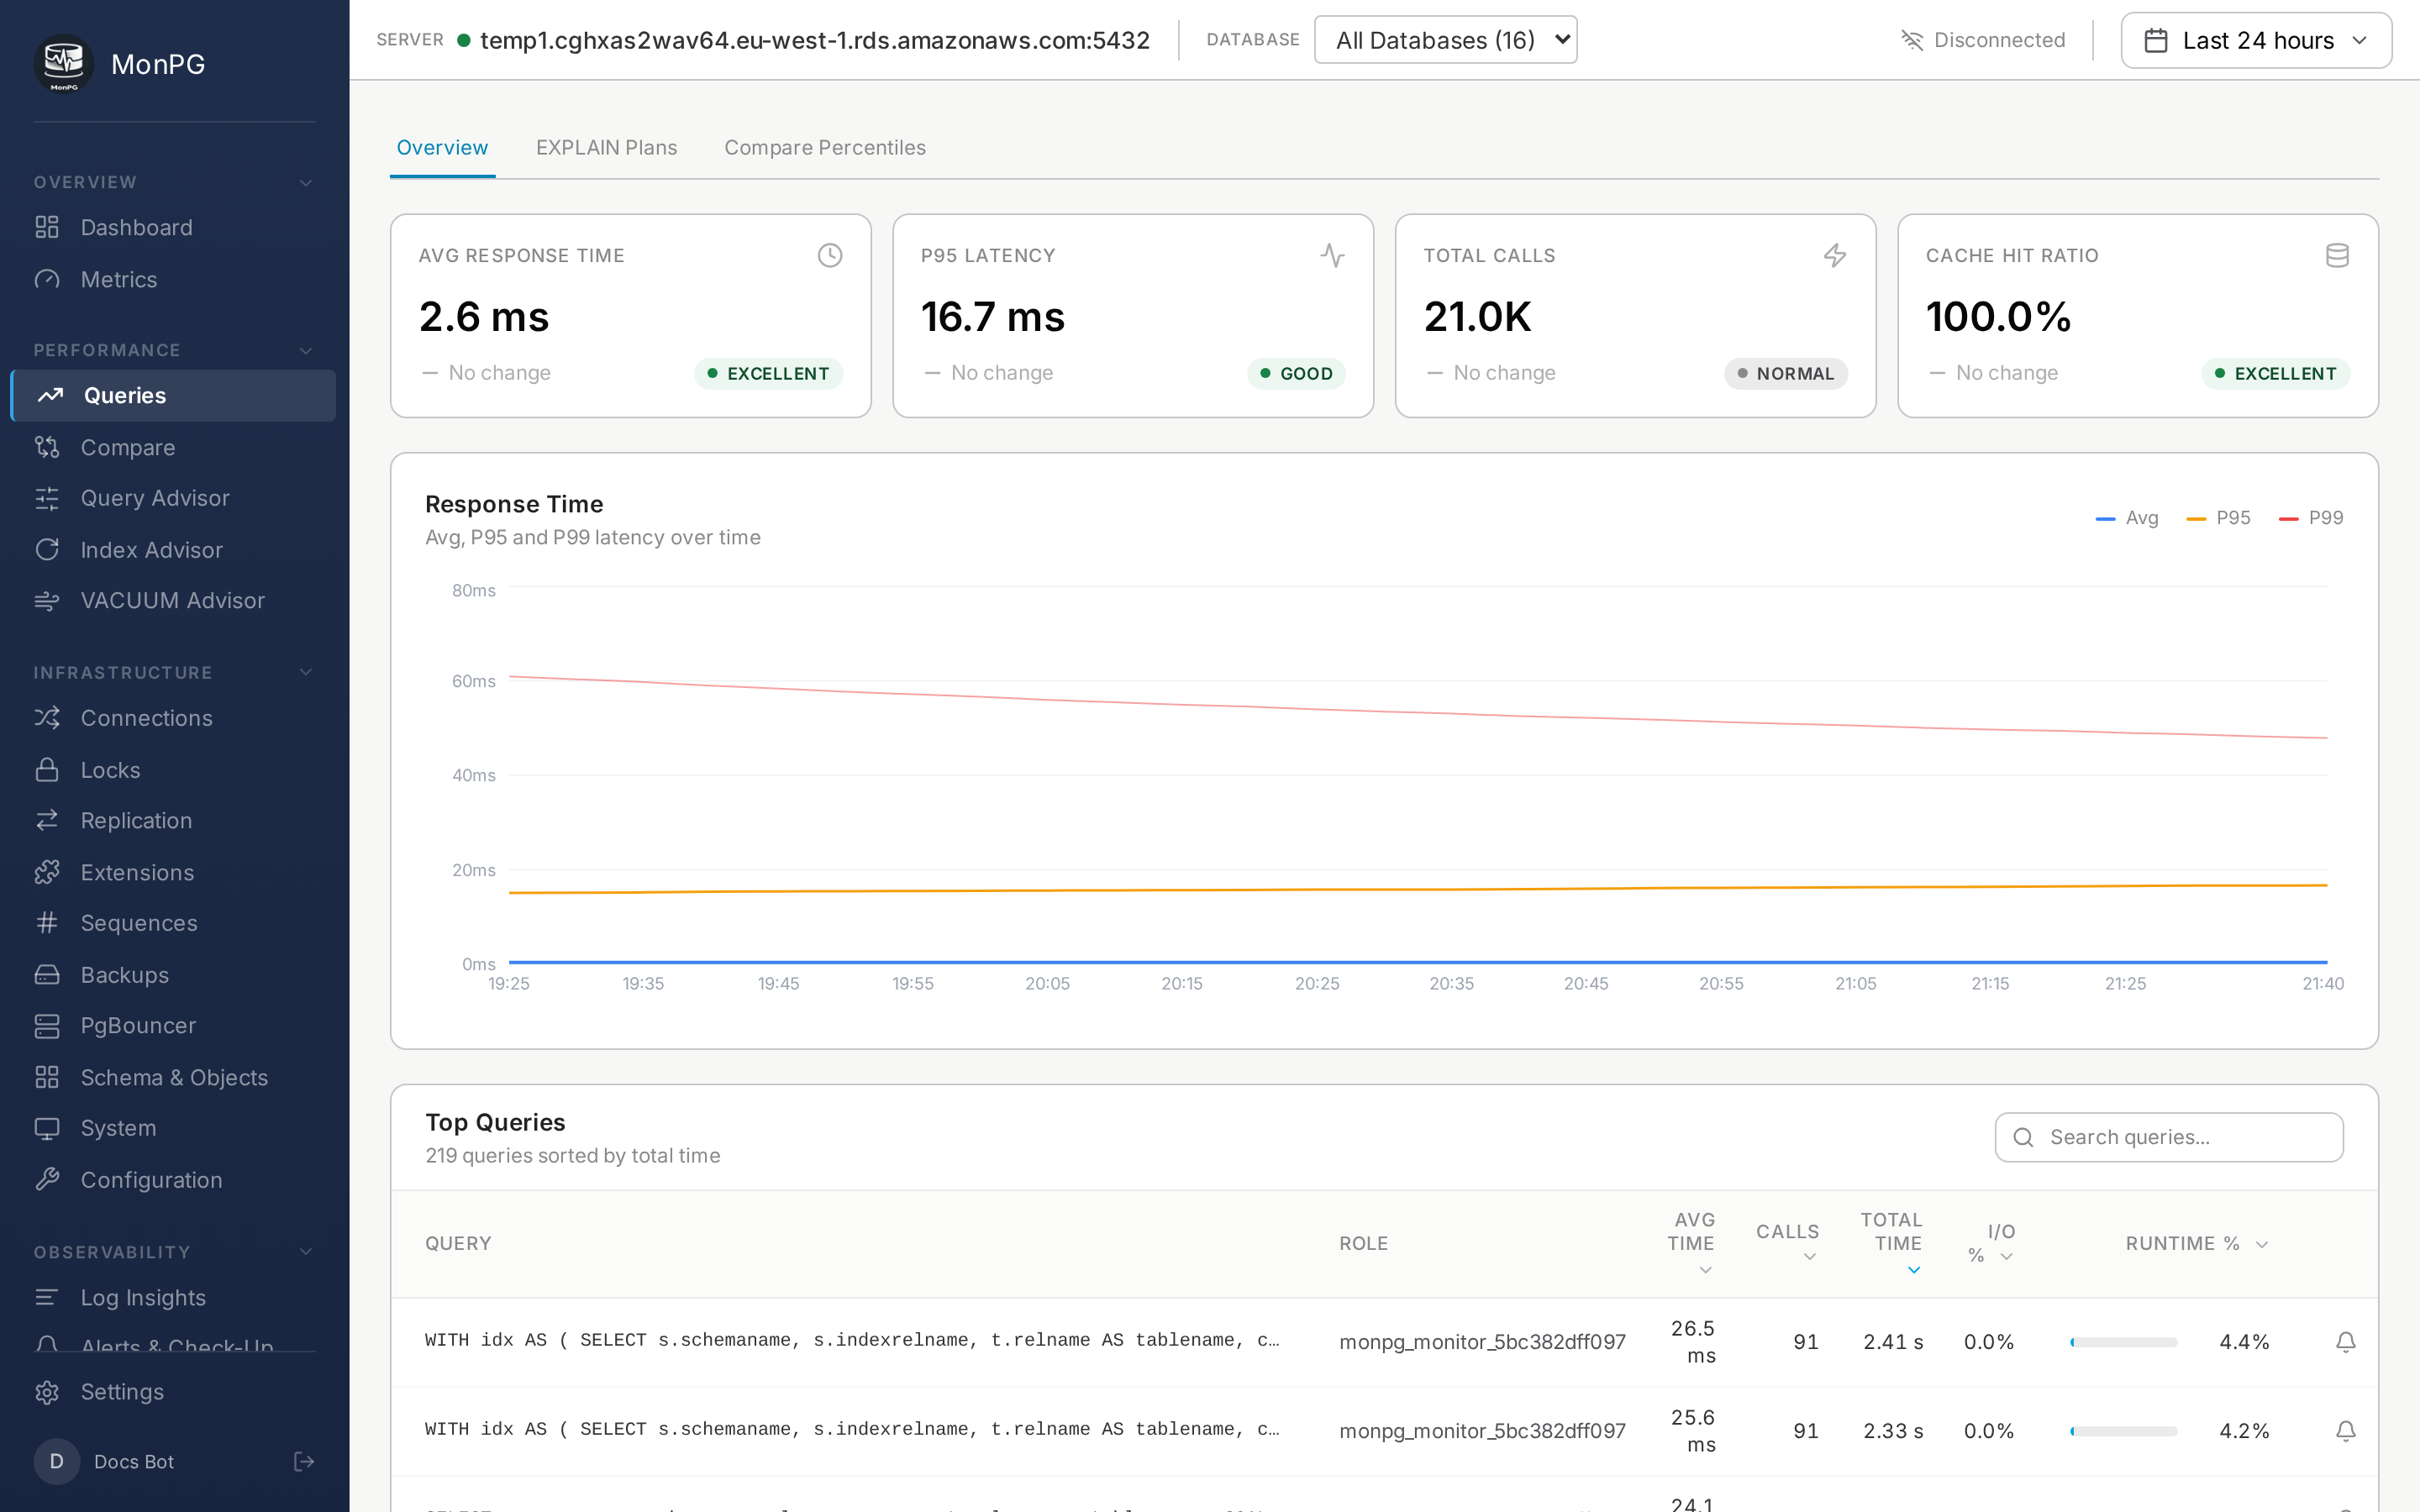
The Queries page is where most users actually live. It's the catalog of what your application is doing to the database, ranked by whichever cost dimension you care about today.
Columns
Query fingerprint: normalized query text with constants stripped. Click to drill in. Calls: delta over the selected time range — total from pg_stat_statements, but only what happened in the window. Mean time: total_time / calls, calls-weighted. Sort descending to find slow queries. Total time: cumulative CPU. Sort descending to find your biggest costs — a 1000ms query running 10k times beats a 10s query running once. Rows: average tuples returned per call. High-rows + low cache hit equals seq scans, usually. Cache hit %: shared_blks_hit / (hit + read). Low means the query keeps loading from disk. I/O time: from track_io_timing=on, split into read and write. User: which role ran it — useful for spotting application queries versus background jobs. Database: which DB it ran on; matters for multi-DB clusters.
Filters
Three at the top: time range (15m / 1h / 6h / 24h / 7d / custom — computes deltas between the start and end snapshot), database (narrow to one DB on a multi-DB cluster), and full-text search on query text (UPDATE accounts narrows to update statements on the accounts table).
How deltas are computed
pg_stat_statements counters are cumulative since server start (or last reset). MonPG picks the first snapshot in your window as the baseline and the last as the end. Delta is end minus start, per query. Queries that didn't run in the window have delta zero and get filtered out. Queries newly seen between baseline and end show their end values directly — full activity in this window.
The usual workflow
- Sort by Total time descending. Find biggest-impact queries.
- Click the top offender, opens Query detail.
- Look at the Trend chart — sudden regression or chronic problem?
- Open the Plans tab — if
auto_explainis installed, the bottleneck node is labeled. - Check Index suggestions — proposed indexes; with
hypopginstalled, "would this help?" runs through real EXPLAIN simulation, not heuristics.