Query Advisor — Understand Slow Queries
How Query Advisor parses captured plans and what the bottleneck labels mean.
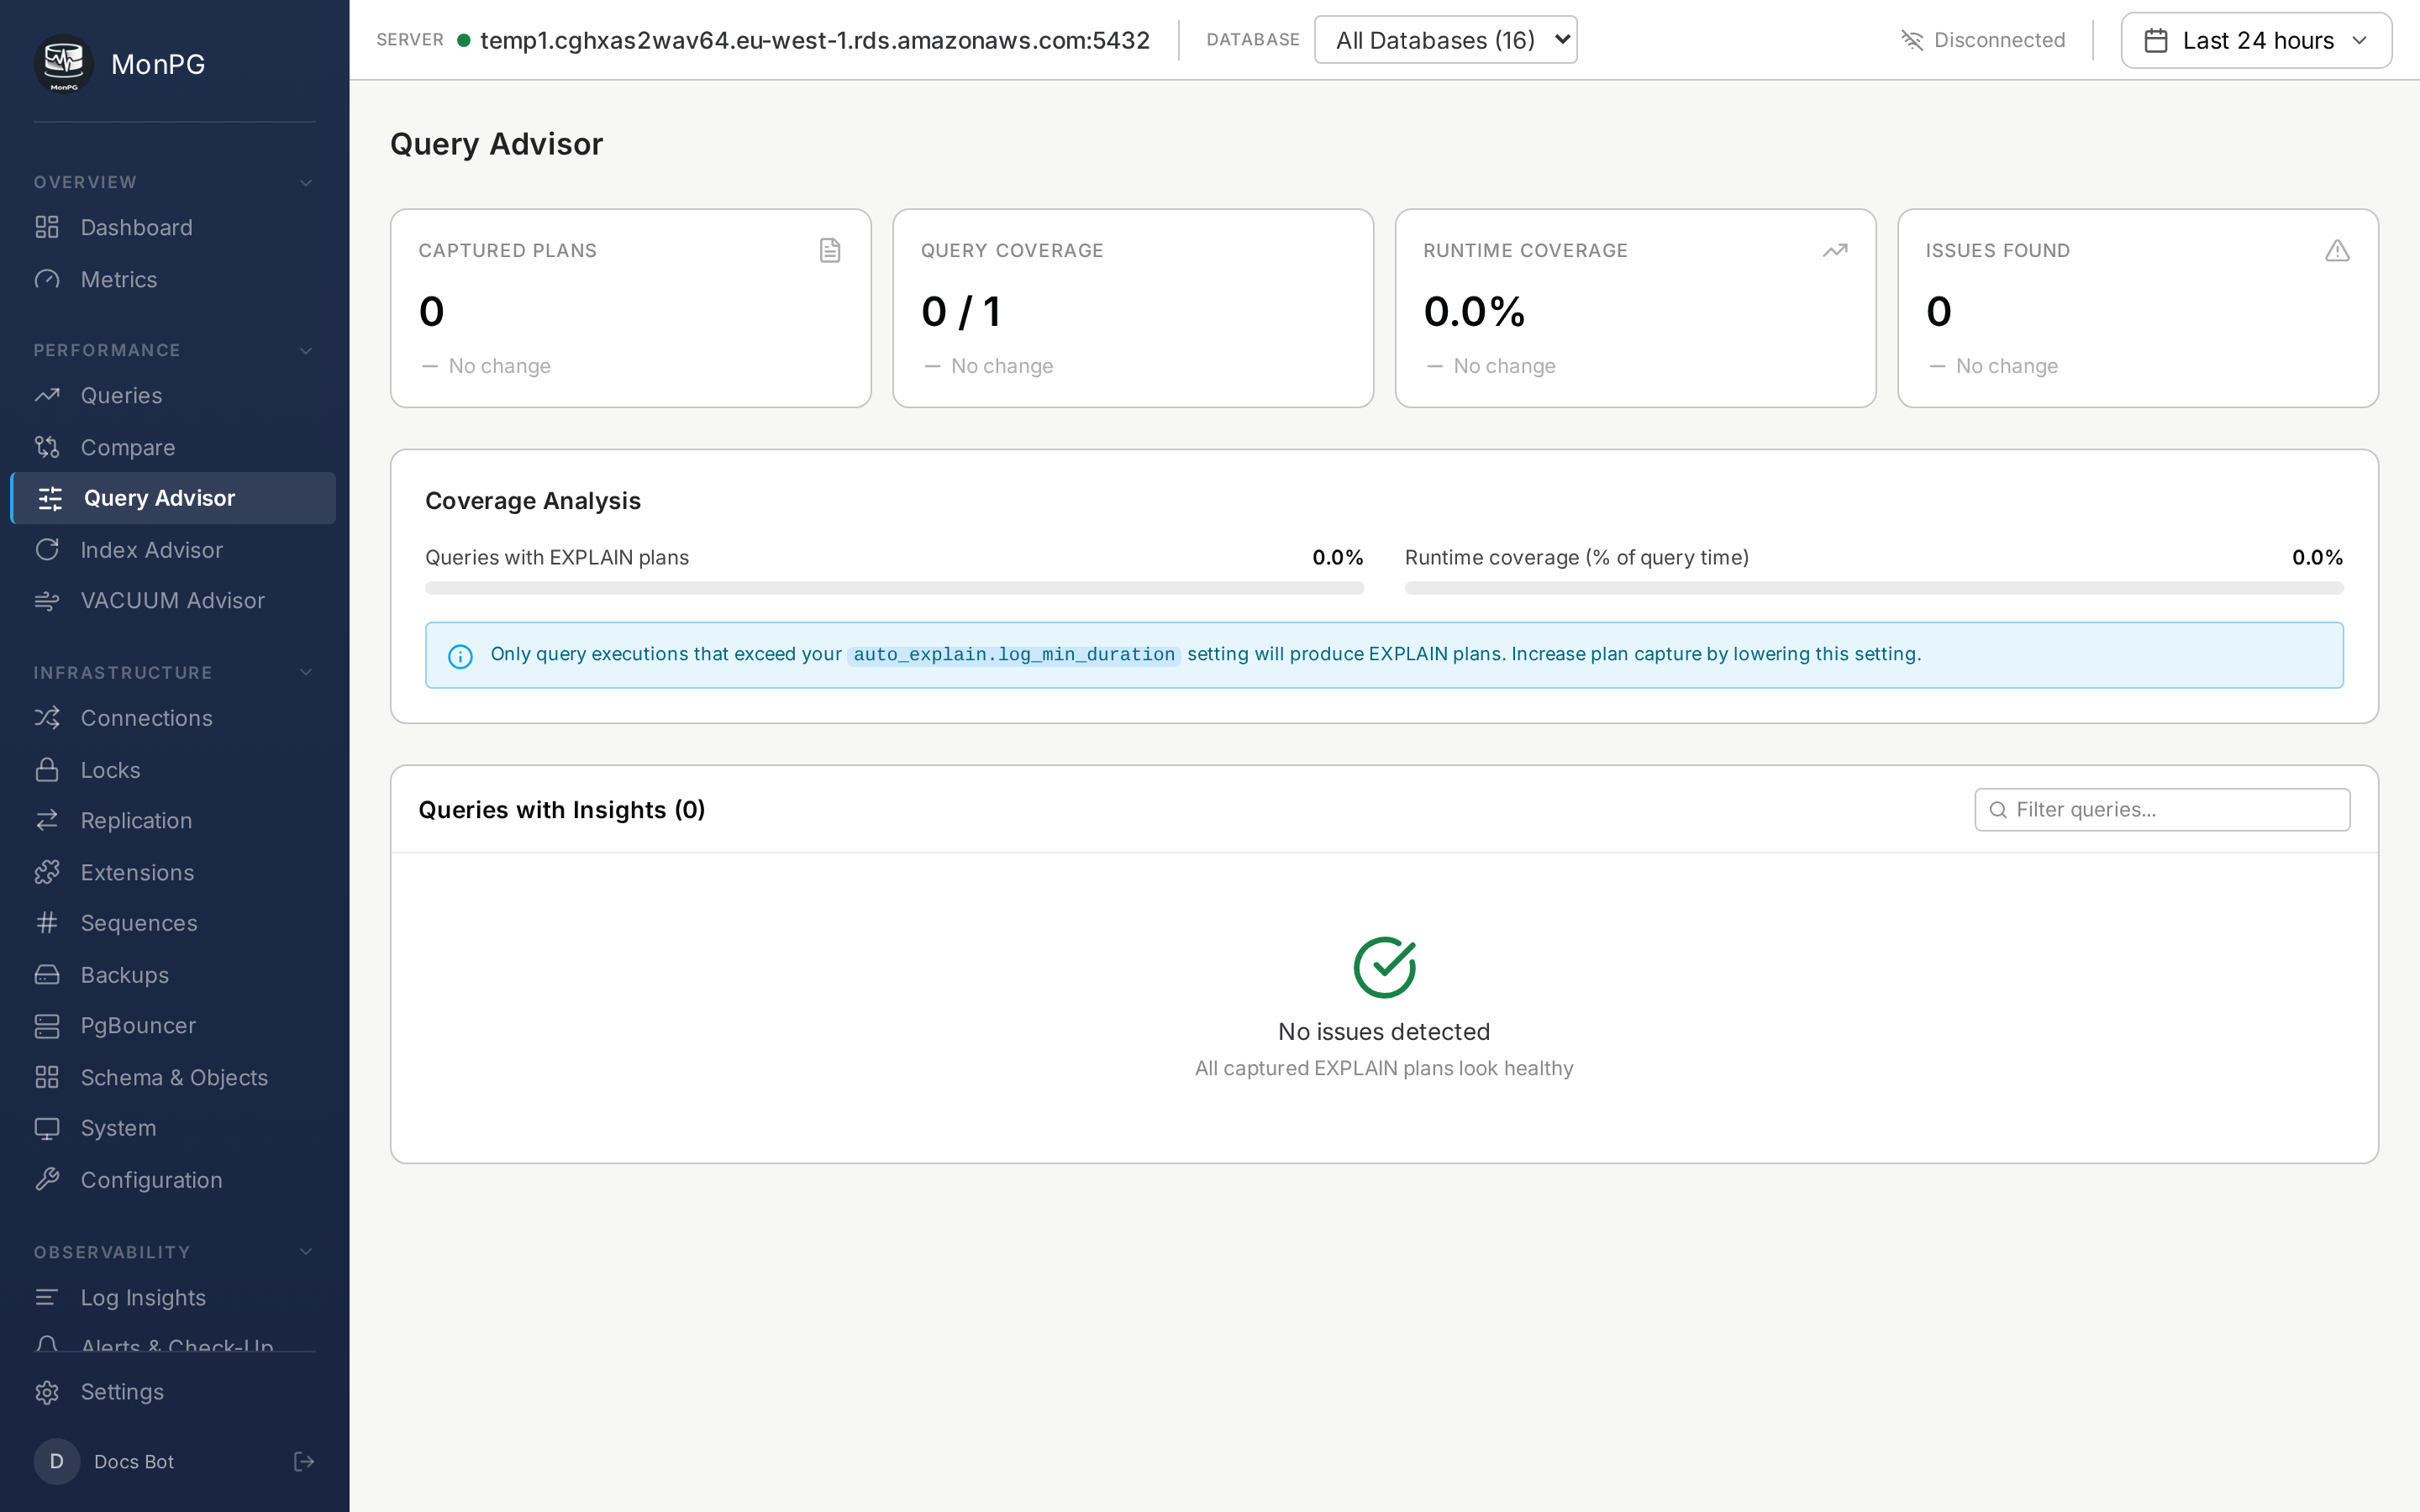
Query Advisor analyzes captured plans. The data feeding it comes from auto_explain — without it in shared_preload_libraries, there are no plans to analyze and the page is empty. See auto_explain setup.
Once auto_explain is loaded with log_min_duration set (we suggest 5000ms), every slow query's plan gets captured and parsed.
Bottleneck labels
The advisor walks each plan's JSON, computes actual versus estimated rows at every node, buffer hit ratios, and execution time, and labels the worst step. The categories you'll see most often:
- Seq Scan on large table — full scan on a relation over 100k rows. Index suggestion follows.
- Nested Loop with high outer rows — O(n²) join. Usually the wrong join order; consider a hash or merge join hint.
- Hash Join spilling to disk — build side too large for
work_mem. Raise it, or filter earlier. - Sort spilling to disk — same root cause, different node. A matching index for sorted scan often fixes it without raising
work_mem. - Estimate off by 10× or more — planner statistics are stale. Run
ANALYZE; if it persists,CREATE STATISTICSon correlated columns. - Low buffer hit ratio — cold cache. Bigger
shared_buffersor warming the cache.
Recommendations
Each diagnosis has an "Apply this" tab with concrete SQL. With hypopg installed, proposed indexes go through EXPLAIN simulation so you see the cost reduction before touching disk. The simulation is the difference between "we think this would help" and "the planner confirms it would help."
Regression detection
The advisor keeps a moving baseline of each fingerprint's mean time. When mean time grows 3× over 10 consecutive snapshots, the query lands on the Regressions tab with the before/after numbers and the timestamp. The "we deployed yesterday and something's slow" question usually answers itself here within minutes.