Connections — Backend Activity and Pool Pressure
See who's connected, what they're running, and whether you're about to hit max_connections.
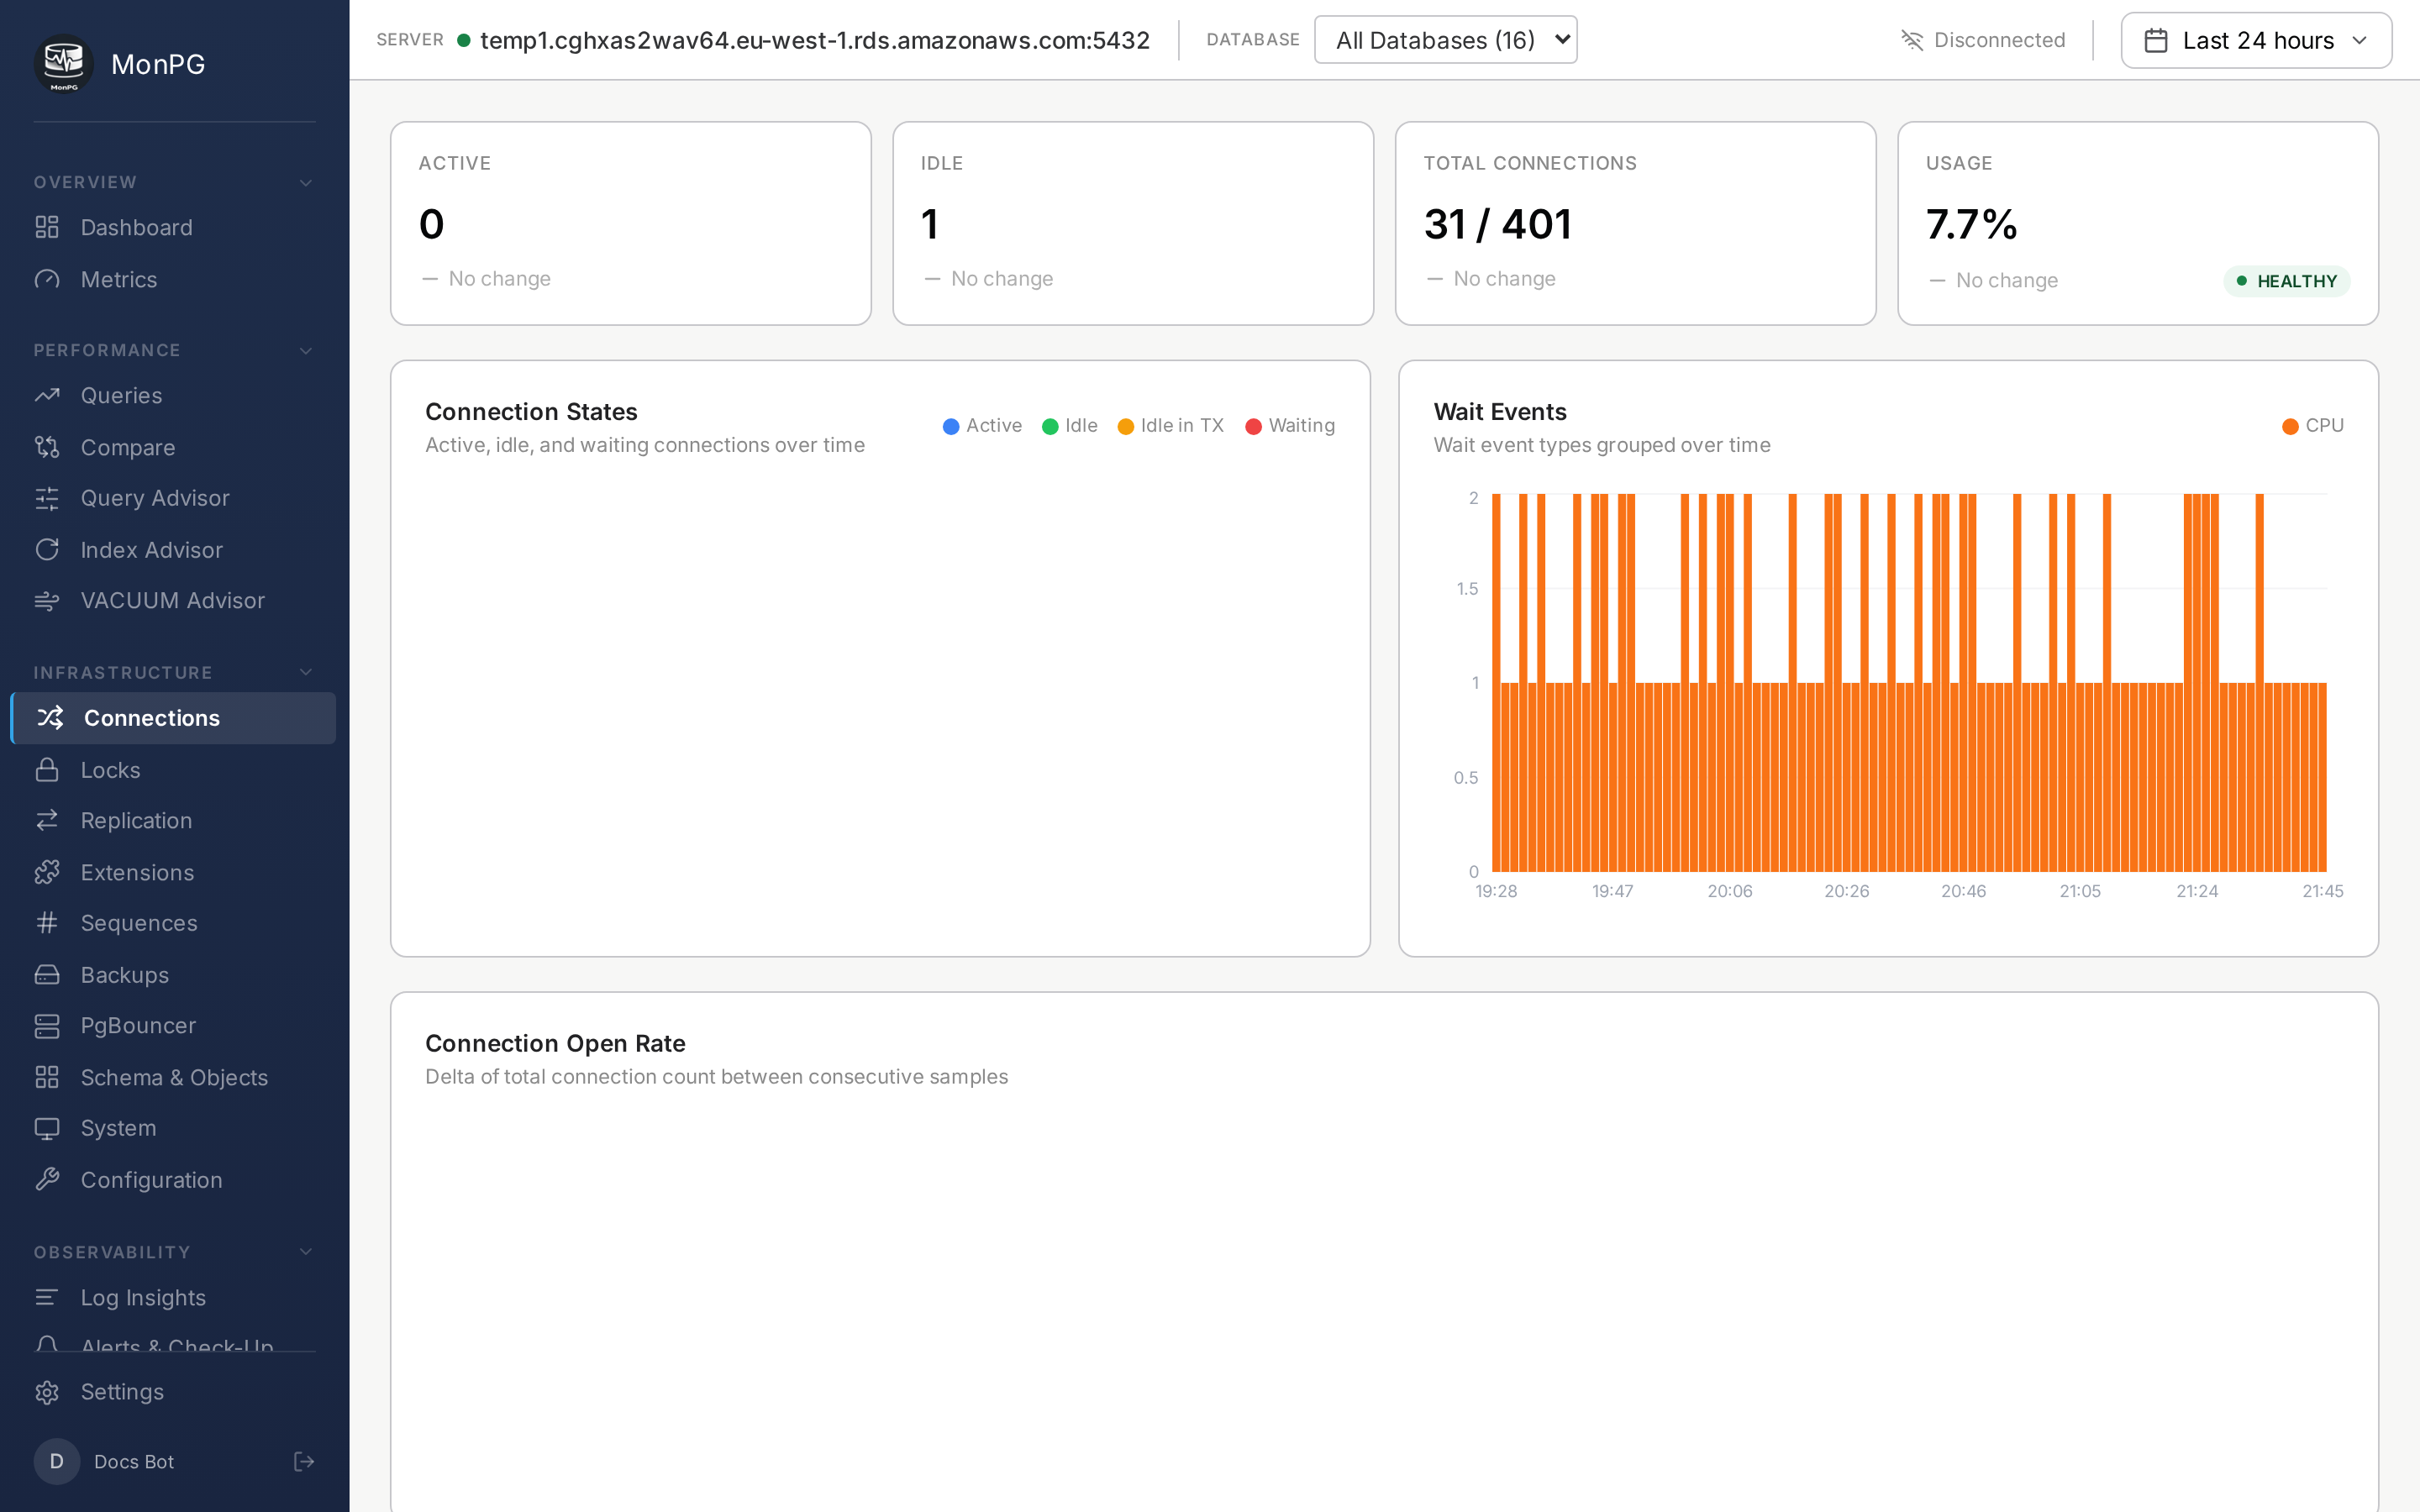
Summary cards
Active / Idle / Idle-in-transaction counts against max_connections. Idle-in-transaction over 5 for more than a minute is a smell; usually the application code isn't committing or rolling back. Peak (last 24h) tells you how close you've come to the cap — 90%+ means you should add a pooler or raise the cap. PgBouncer stats appear here too if we detect one fronting the cluster: pool client count, server connections, wait queue, long transactions.
Backend table
Every active backend, with PID, application name, client IP, user, database; state (active / idle / idle in transaction / waiting); current query plus query start time; wait event and wait event type if non-idle and waiting; backend start time and transaction start time.
You can kill backends from this page — the ⛔ icon runs pg_terminate_backend(pid). This requires the monitor role to have pg_signal_backend, which we don't grant by default. Enable it explicitly if you want kill-from-UI; otherwise the column shows the icon disabled, which is the safer default.
Wait events
If pg_wait_sampling is installed, each backend's historical wait profile shows as a small sparkline next to its row. Saves you from having to be at the keyboard the moment slowness happens. Setup here.