Locks — See Blocked Queries and Lock Waits
Find the blocker when a query hangs. Lock graph + wait event decoded.
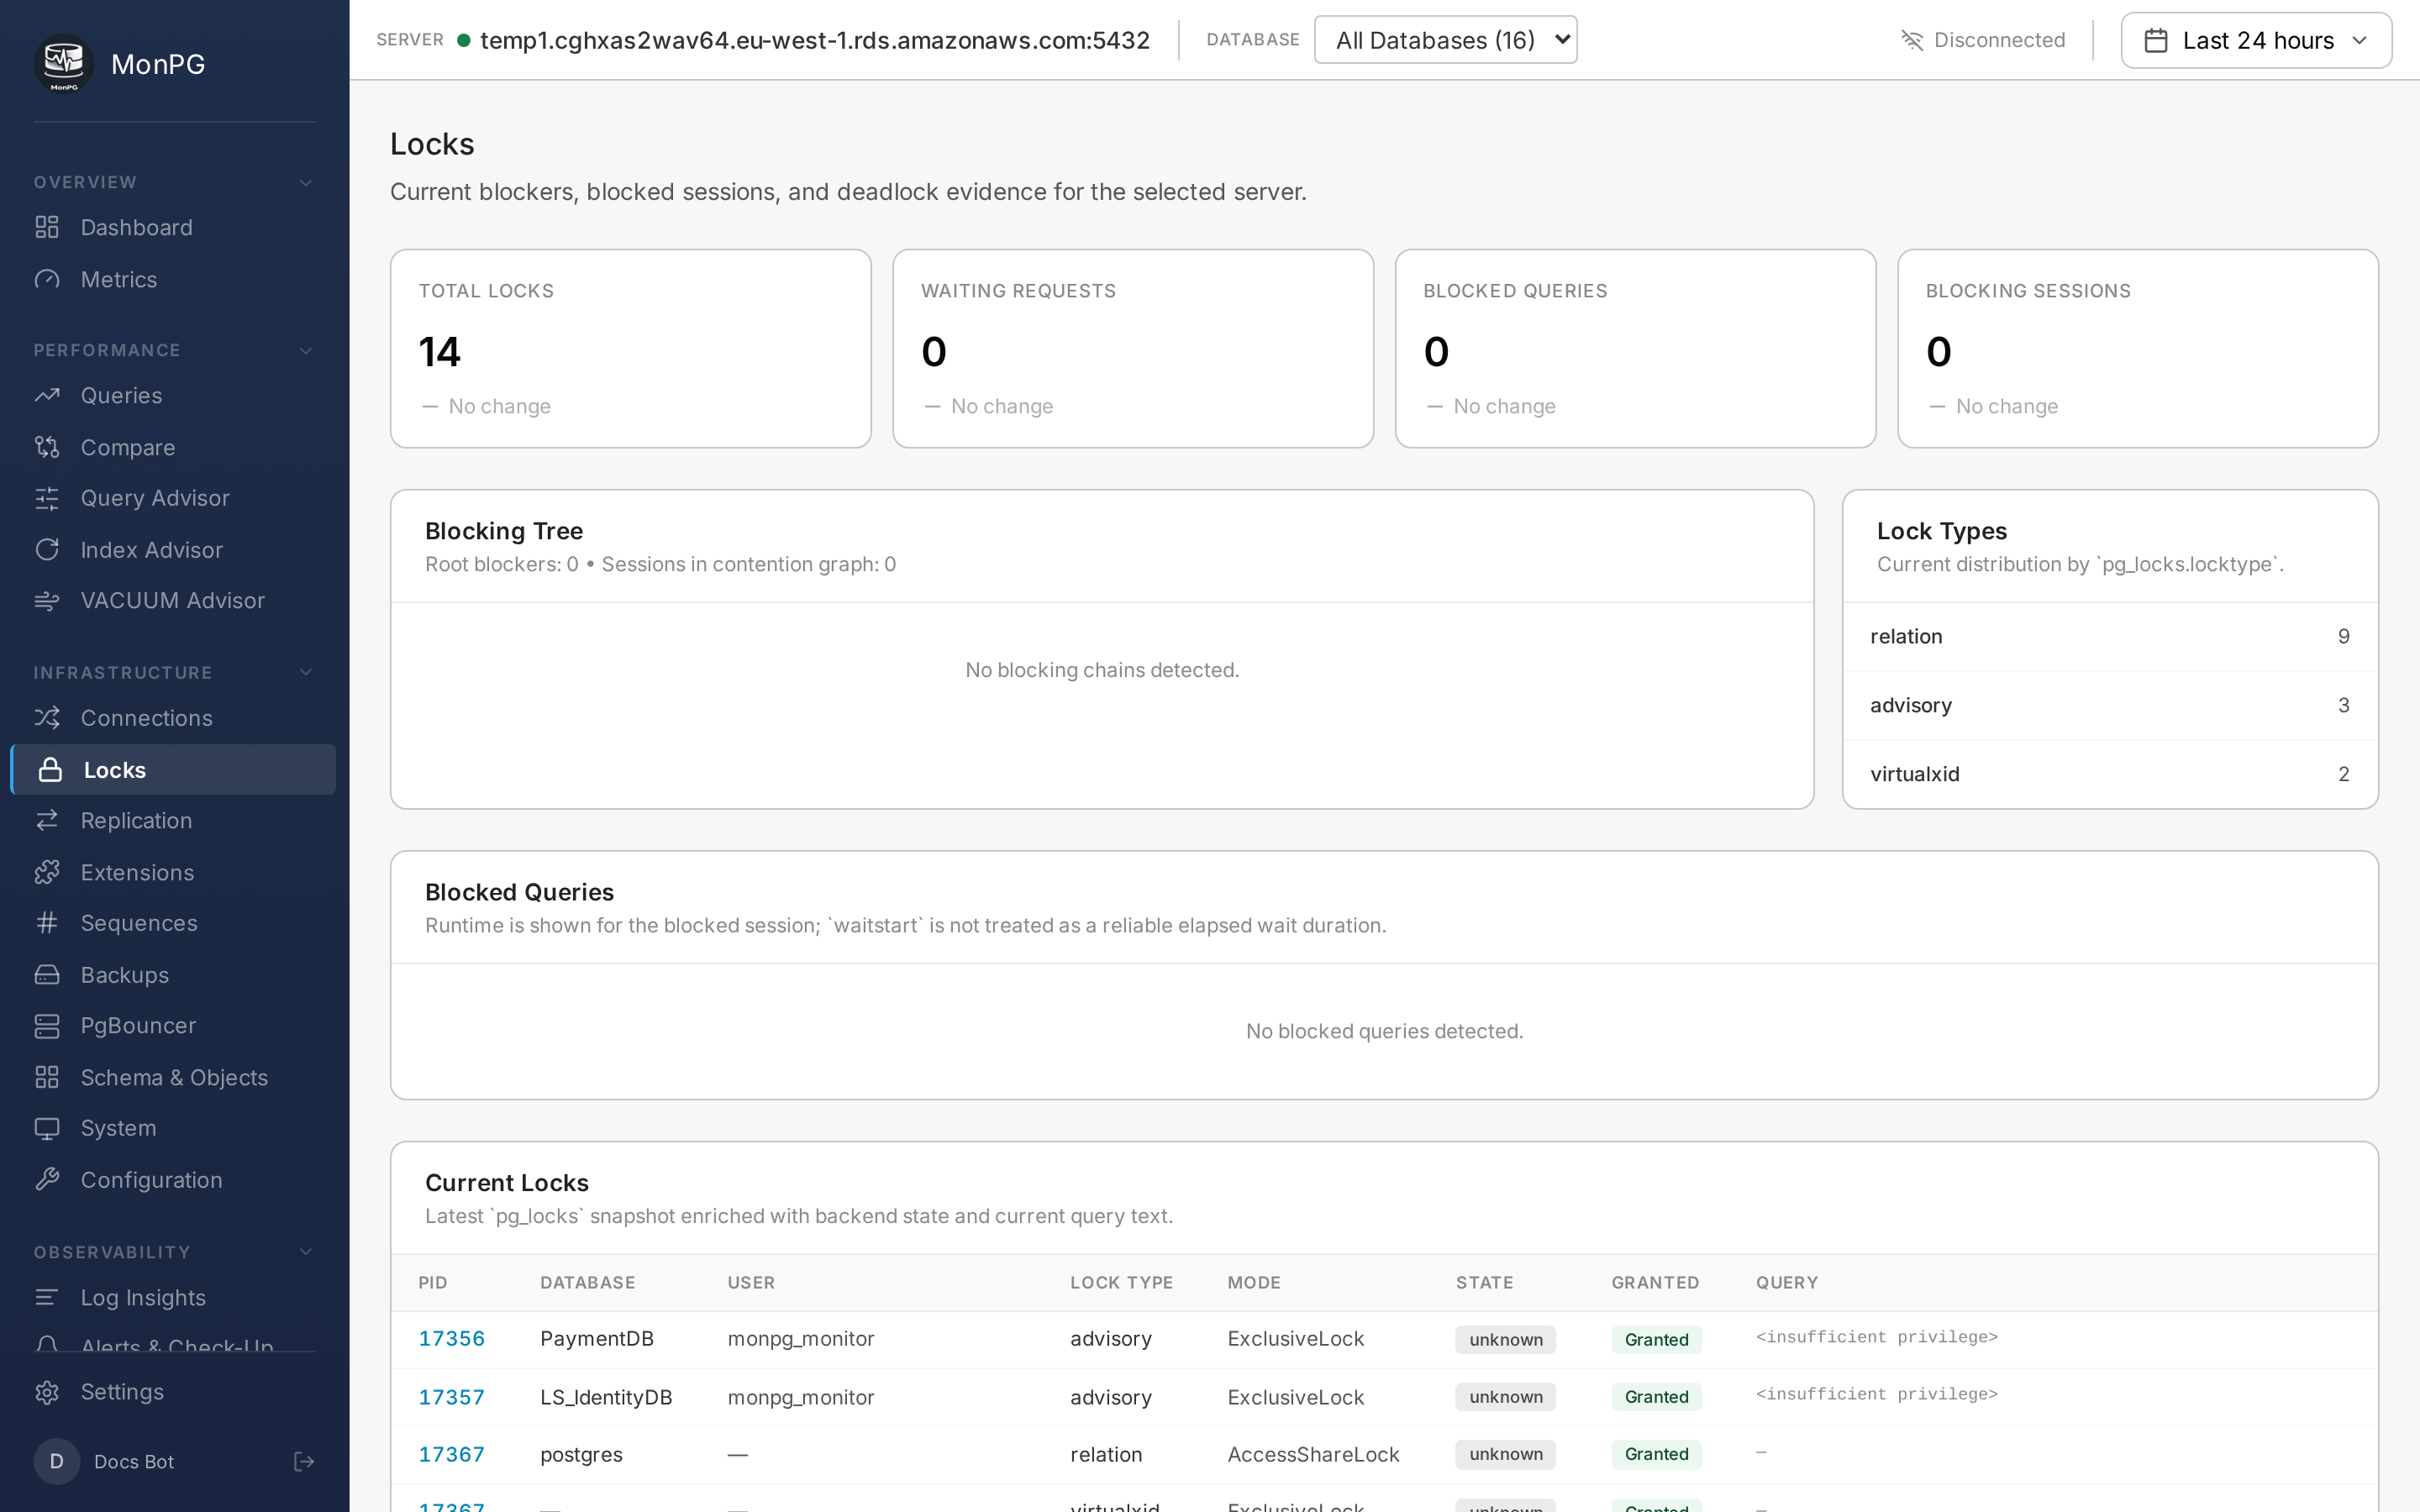
The Locks page joins pg_locks with pg_stat_activity to show every backend currently waiting on a lock — what they want, who's holding, and how long the wait has been going on.
Per row
Waiter PID, the blocked backend. Waiter query, what it's trying to do. Lock mode wanted — AccessShareLock, RowExclusiveLock, AccessExclusiveLock, etc. Wait duration. Holder PID, the one blocking. Holder query, what the holder is running — or "idle in transaction," which is the worst kind because it means someone opened a transaction, did some work, and then forgot to close it.
Lock graph
A visualization of the wait-for graph. When a chain forms — A waiting on B waiting on C — the graph shows the hierarchy clearly. Click any node to center on it and see its subtree. Most lock incidents are simple two-party situations; chains usually mean something bigger has gone wrong.
Patterns we see often
Long-running DDL behind app queries — an ALTER TABLE taking AccessExclusiveLock blocks everything else. Schedule DDL during a maintenance window. Idle-in-transaction holder, where the holder is "idle" but holding a row lock; this is almost always an app bug (transaction opened, work done, no commit or rollback). And VACUUM FULL hitting a busy table — same lock pattern, same advice: use pg_repack instead.