Log Insights — Errors, Patterns, and Categorization
PostgreSQL log analysis: top error patterns, query error correlation, log-pattern alerts.
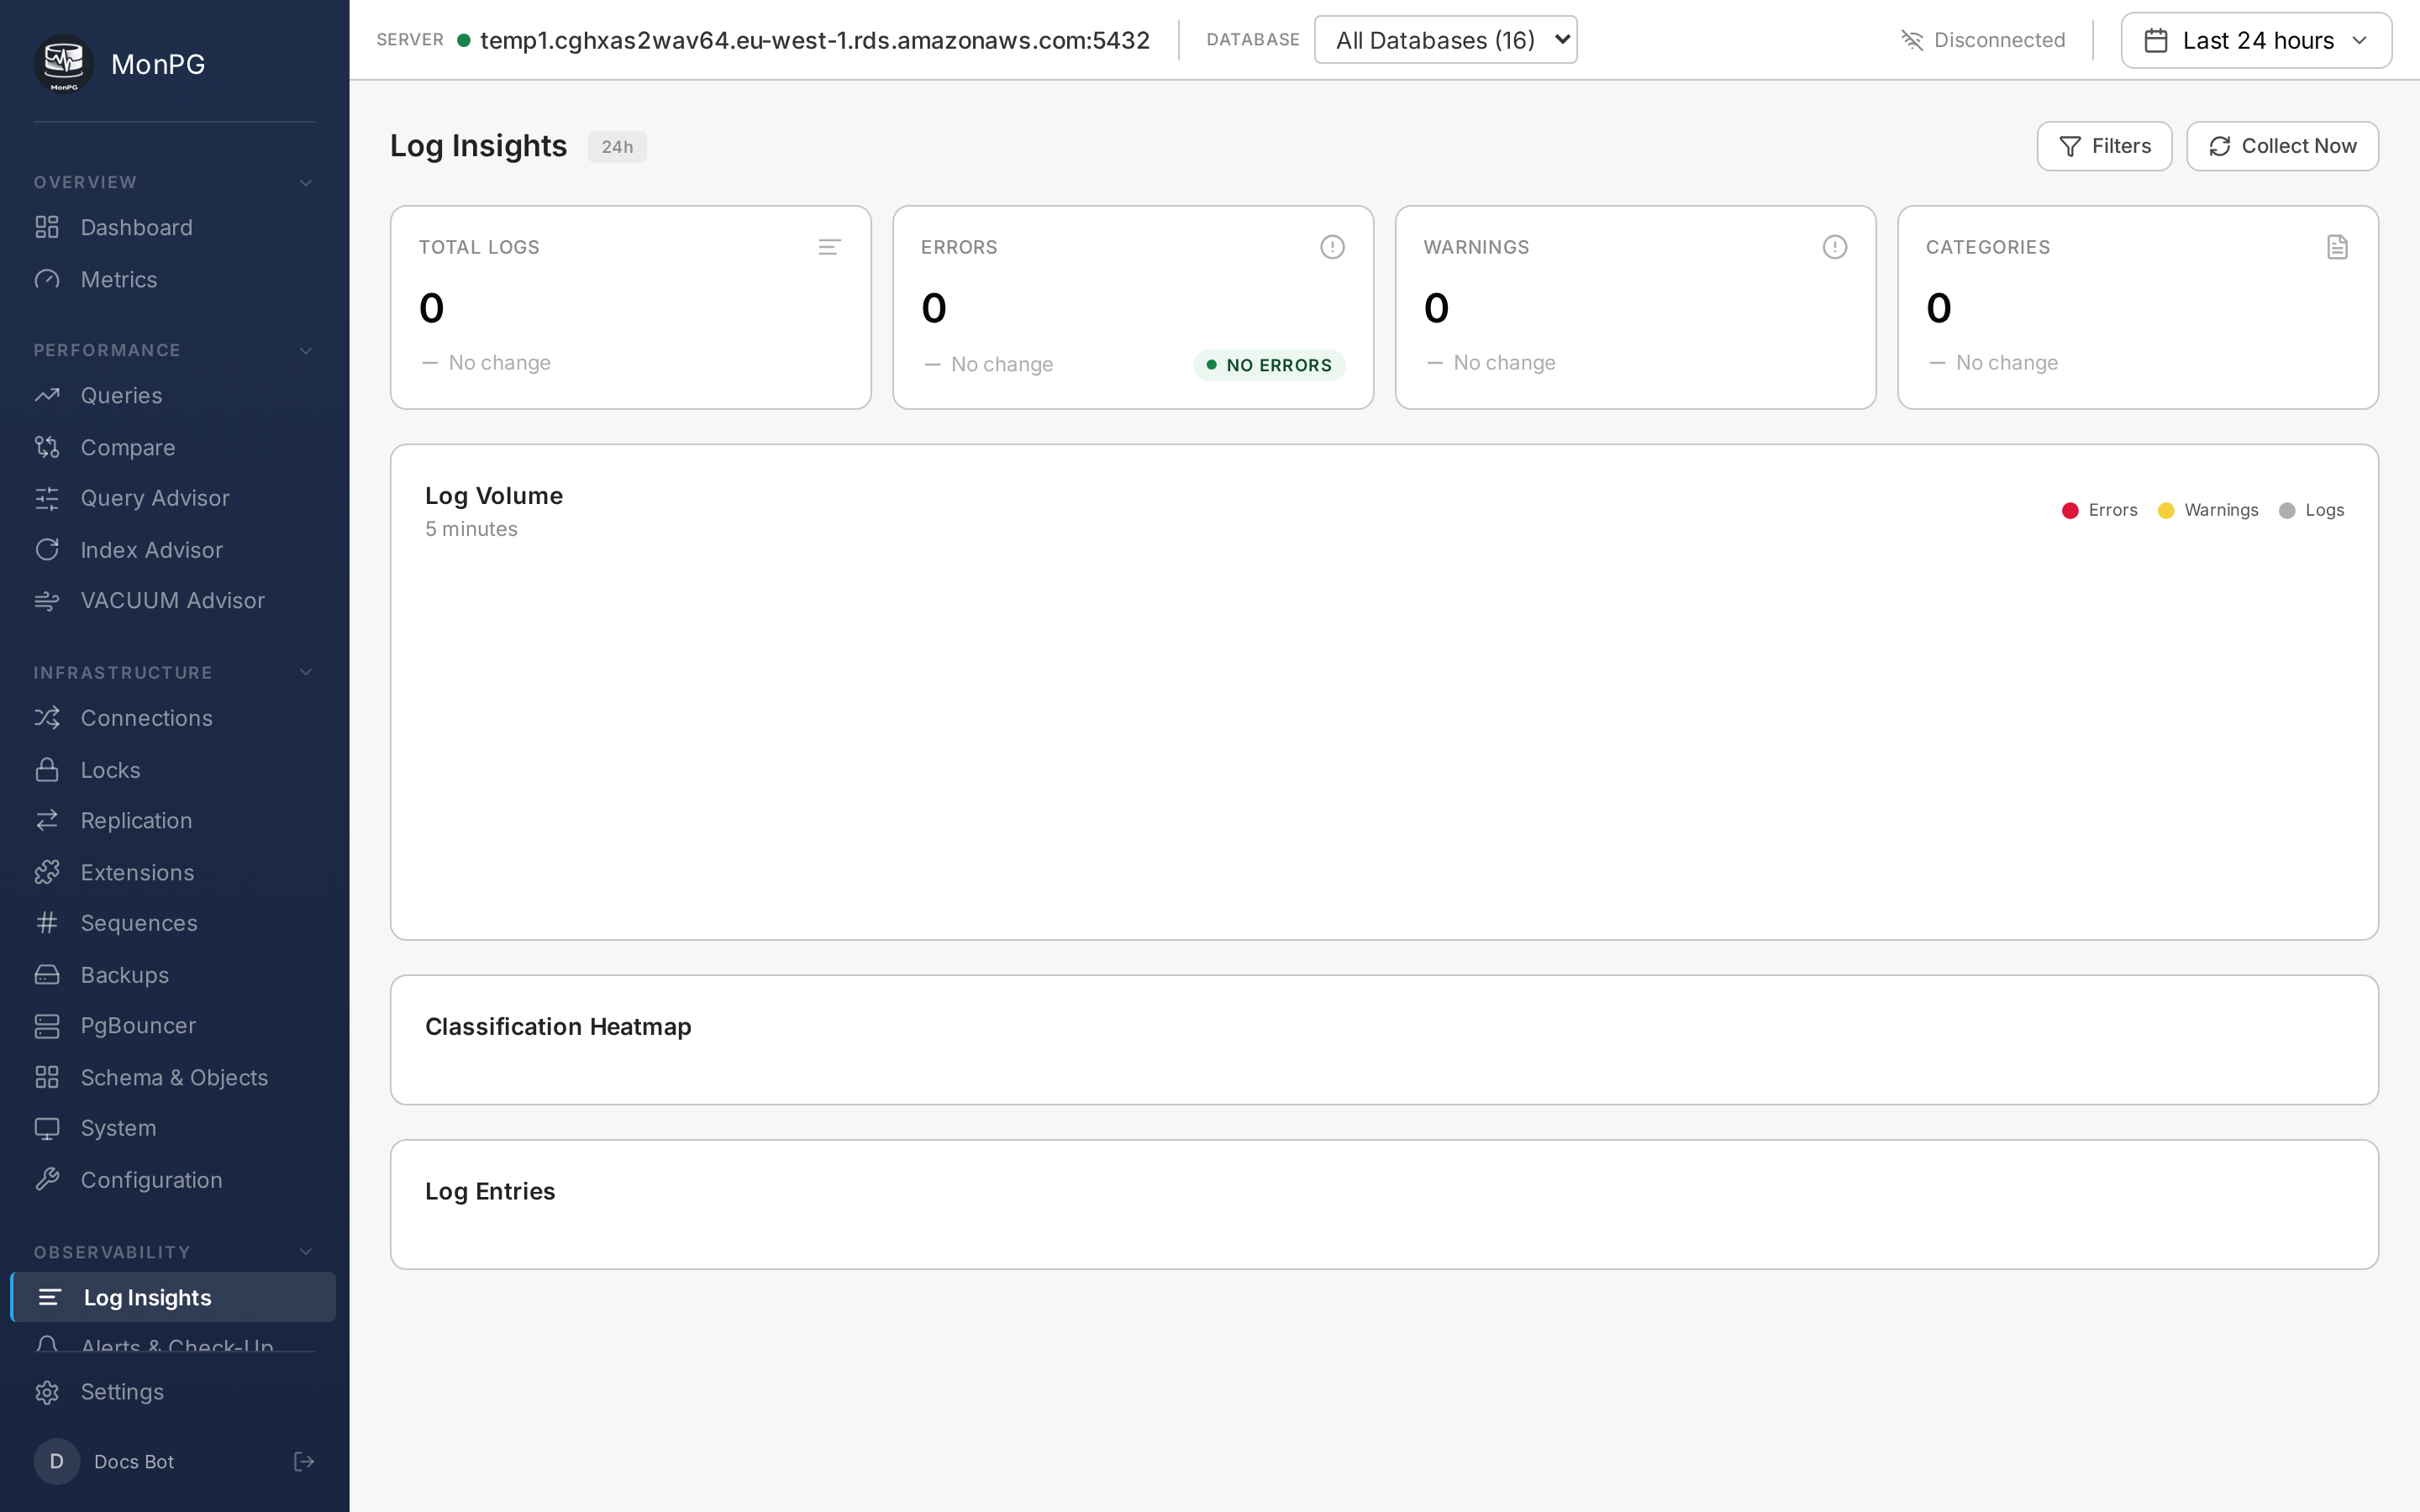
Log Insights reads from your cluster's log stream. The setup varies by provider but the analysis after that is identical.
Setup by provider
AWS RDS uses CloudWatch Logs, with an IAM role granting logs:GetLogEvents + rds:DescribeDBLogFiles. Configure under Settings → Servers → AWS cloud integration; the full step-by-step lives on the AWS log setup page. Azure Flex uses Diagnostic Settings → Event Hub (preferred) or Log Analytics, with a Service Principal carrying Event Hub Data Receiver. Cloud SQL uses Cloud Logging with a service account scoped to roles/logging.viewer. Heroku is Logplex syslog drain (Cedar) or OTLP telemetry (Fir). Self-managed is file tail via pg_read_file() through the monitor role — needs an explicit grant.
Categorization
Every log line gets categorized as one of: connection authentication, query errors (syntax, constraint violations, type errors), lock timeouts and deadlocks, slow query logs (from log_min_duration_statement), autovacuum runs, checkpoint activity, replication events, or security/audit (pgaudit lines if enabled). The categorization is heuristic — pattern matching on standard PostgreSQL log shapes — and it's the basis for filters and counts.
Pattern detection
Similar error messages get grouped by fingerprint, with variable parts (table names, user IDs) normalized. A sudden spike of a brand-new pattern creates a change alert. The "we deployed something and errors climbed" workflow lives here — you usually find the cause in two clicks.
Log-pattern alerts
You can define custom alerts that fire on log patterns. Example: alert when "deadlock detected" appears more than 5 times per minute. Sliding-window regex match on the log stream. Alert rules covers the syntax.