Creating Alert Rules
Threshold, pattern, query-metric, and custom SQL rules — when to use each.
MonPG has four kinds of alert rules. They look the same on the rule list but the underlying evaluators are different, and which one you reach for depends on what you're trying to catch.
The first kind is the threshold rule. You pick one of the 20 built-in metrics (cache hit ratio, connection saturation, replication lag, the usual suspects), set a number, MonPG fires when it crosses. These ship enabled with sensible defaults. You can clone any of them to override thresholds without losing the original — handy if you want a stricter version of "replication lag" for prod and the default for staging.
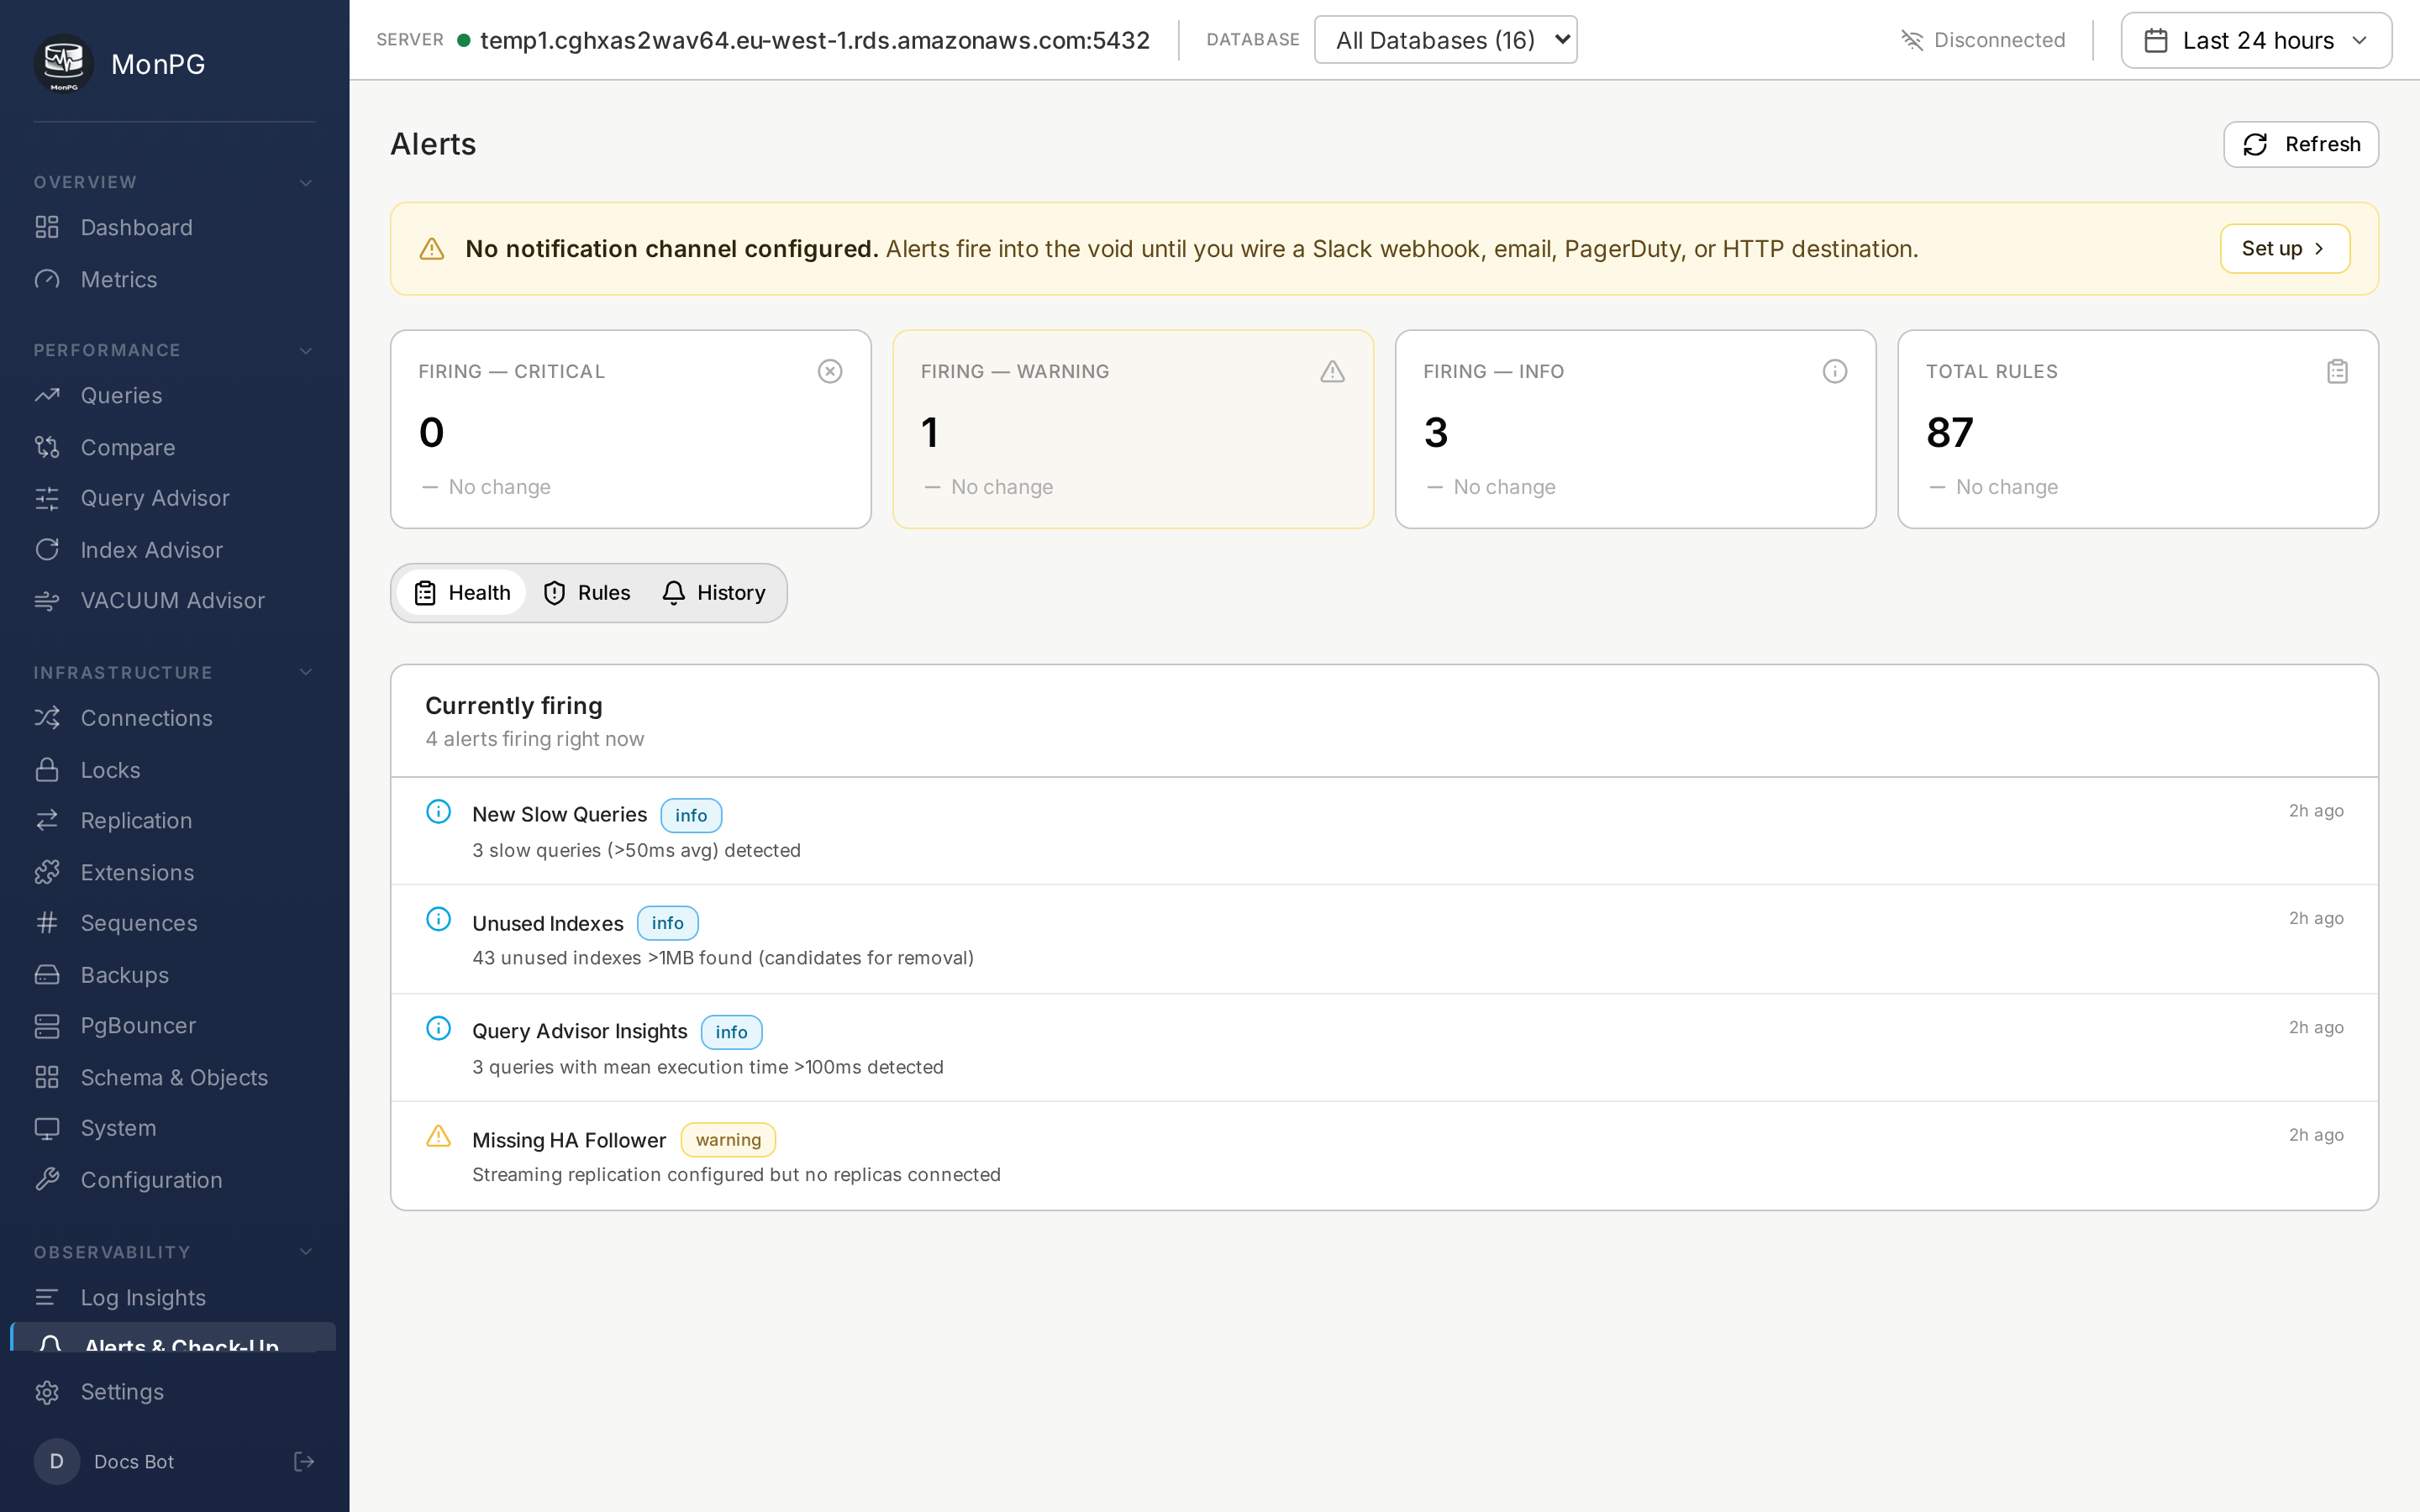
The second is the pattern check. These run once per cycle and answer yes/no questions about the cluster's shape rather than measuring a metric: is autovacuum off on a 100MB+ table, are there orphaned replication slots, is pg_stat_statements missing on any database. There are 37 of these. Most teams leave them all on; the noise is low because they only fire when something is structurally off.
The third is the query metric rule. You're on the Queries page, you see one query whose mean time has been creeping up, you click "Alert on this". MonPG snapshots that query's queryid and tracks its delta from there. Useful for "this report query should not take longer than 5s, page me if it does." More targeted than threshold rules, which look at the whole cluster.
The fourth is custom SQL. You write a SELECT that returns one number, MonPG runs it every cycle under a statement timeout, compares to your threshold, fires when the condition holds for N seconds. Classic example:
SELECT count(*) FROM orders WHERE status = 'pending' AND created_at < now() - interval '30 min';Now you have a "payments queue backlog" alert that's specific to your app. The query is parsed at save time against a SELECT-only guard — DDL, DML, SET, COPY all rejected — and re-validated at execute, so a hot-swap of the rule body can't sneak something nasty in.
What goes on a rule
Name the rule something you'd recognize at 3am: "Payments queue backlog" beats "alert_rule_47". Severity is info / warning / critical and feeds into routing — critical can go to PagerDuty, warning to Slack only, info to the digest email. The threshold is the obvious one. Duration matters more than people think: setting it to 0 means you fire on the first sample over the line, which guarantees flapping. Most teams set 60-300 seconds depending on how spiky the metric is.
Channels are picked from your org's notification list (Slack/PagerDuty/email/webhook configured in Settings). And there's a "muted until" field — silence the rule for a window without losing it. Useful during planned maintenance.
Rule history
Every fire and recover writes a row to rule_history. The rule detail page shows the timeline: when it fired, what value triggered it, when it cleared. That's the table to query during an incident review when someone asks "when did this start." No separate audit log to dig through.